Social Network Mining
Period: 04/2022
Project Name: Social Network Mining
Machine Learning Python networkx numpy os pandas matplotlib itertools collections gensim.models (Word2Vec) sklearn plotly
What's the Project For?
- Course Project of the "Advanced Data Mining for Risk Management and Business Intelligence" course for the degree BSc in Risk Management and Business Intelligence.
- Perform link prediction between 2 users in a social network, which link prediction is done by computing node (user) similarity in the embedding space. Model performance was evaluated by the AUC-ROC score.
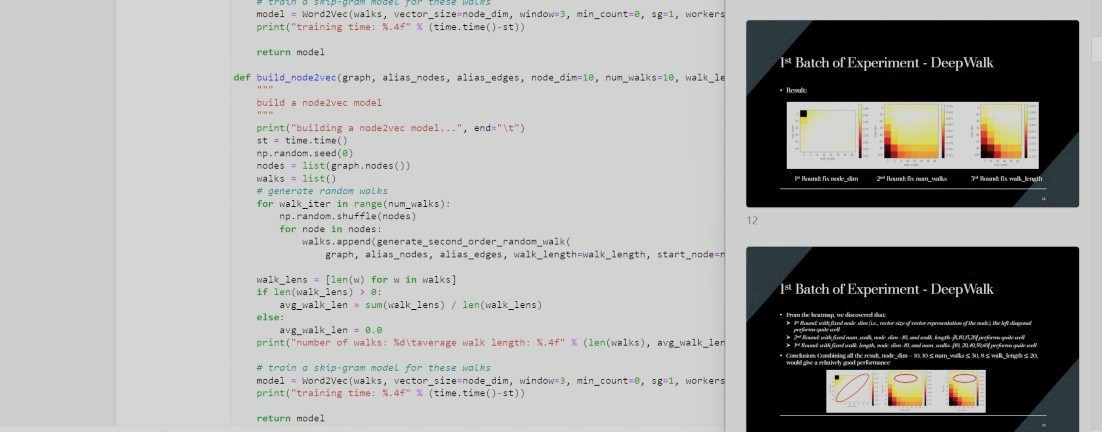
Project Description
The pipeline of the project is as follows:
1. Data Loader
- Load training data and validation data (from user_id and friends list --> to edges (user_id, frd1), (user_id, frd2), ...)
- Load test data (from src and dst --> to edge (src, dst))
- Construct a directed graph with networkx using the training edges
- Generate false edges (edges that does not exist in both training and validation dataset) for later validation use
2. Generate Random Walk
- 1st-order for DeepWalk, 2nd-order for Node2Vec for later training
3. Training/Hyperparameters Tuning
- Learn the model (either DeepWalk or Node2Vec) which transform a node to its vector representation
4. Validation/Performance Evaluation
- Covert validation set into true edges & combine with the false edge generated before
- Use the model to transform all the nodes into vector representations
- Calculate the cosine similarity between 2 nodes for both true edges & false edges (as a measure to see how likely they are linked)
- Calculate the AUC-ROC score to evaluate the model performance (i.e., see how well the model can represent nodes in the vector space, so that the cosine similarity between 2 nodes could reflect whether there is a link between 2 nodes)
The final model of our project is the DeepWalk model with parameters node dimension = 10, walk length = 17, and number of walks = 17, which gave us a validation AUC-ROC score of 0.9346 (> strong baseline 0.9290).
Most Challenging Part of the Project?
The most challenging part of the project is to visualize the performance of different models during the hyperparameters tuning process. Since I wanted to tuning multiple hyperparameters all at once for less human monitoring effort during tuning, heatmap was not enough to visualize the models' performance. In the end, after some researches, I was able to construct a parallel coordinates plot using the plotly library, and it was a rewarding process!